How Austrian Galicia’s Land Distribution Drove a Generation to Emigrate
| Category | Houses | Male | Female | Total Population |
| Ortsgemeinde (Village) | 153 | 480 | 496 | 976 |
| Gutsgebiet (Estate) | 7 | 27 | 29 | 56 |
| Combined Total | 160 | 507 | 525 | 1,032 |
Key Observations
- Population Density: The village population is significantly larger than the surrounding estate, accounting for roughly 95% of the total population of Putiatynce.
- Gender Balance: The population is very well-balanced, with a slight majority of females (525) compared to males (507).
Census documents a decade later provide a much more detailed breakdown for Putiatyńce, including religious affiliation and spoken language.
| Category | Houses | Male | Female | Total |
| Ortsgemeinde (Village) | 174 | 501 | 508 | 1,009 |
| Gutsgebiet (Estate) | 6 | 29 | 20 | 49 |
| Combined Total | 180 | 530 | 528 | 1,058 |
Village Religious Confession
| Religion | Population | Percentage |
| Greek Catholic (gr.-kat.) | 959 | 95.0% |
| Roman Catholic (rzym.-kat.) | 40 | 4.0% |
| Jewish (israelit.) | 10 | 1.0% |
Estate Religious Confession
| Religion | Population | Percentage |
| Greek Catholic (gr.-kat.) | 15 | 30.6% |
| Roman Catholic (rzym.-kat.) | 24 | 49.0% |
| Jewish (israelit.) | 10 | 20.4% |
Village Spoken Language
| Language | Population | Percentage |
| Ruthenian (ukrainisch) | 955 | 94.6% |
| Polish (polski) | 50 | 5.0% |
| German (deutsche) | 4 | 0.4% |
Estate Spoken Language
| Language | Population | Percentage |
| Ruthenian (ukrainisch) | 5 | 10.2% |
| Polish (polski) | 38 | 77.6% |
| German (deutsche) | 6 | 12.2% |
Key Observation
- Infrastructure: The village is noted as having a Greek Catholic Local Chaplaincy (G.-k. Lok.) and a school (Sch.).
This dataset is particularly rich because it includes land area (in square kilometers) and a more detailed breakdown of the estate (Gutsgebiet), which now includes the settlement of Zabiniec.
| Category | Land Area (Sq. kms) | Houses | Male | Female | Total |
| Dorf (Village) | 9.83 | 201 | 600 | 631 | 1,231 |
| Gutsgebiet (Estate) | 4.67 | 9 | 42 | 40 | 82 |
| Combined Total | 14.5 | 210 | 642 | 671 | 1,313 |
Village Religious Confession
| Religion | Population | Percentage |
| Greek Catholic (gr.-kat.) | 1,116 | 90.7% |
| Roman Catholic (rzym.-kat.) | 104 | 8.4% |
| Jewish (israelit.) | 11 | 0.9% |
Estate Religious Confession
| Religion | Population | Percentage |
| Greek Catholic (gr.-kat.) | 10 | 12.2% |
| Roman Catholic (rzym.-kat.) | 50 | 61.0% |
| Jewish (israelit.) | 22 | 26.8% |
Village Spoken Language
| Language | Population | Percentage |
| Ruthenian (ukrainisch) | 1,116 | 90.7% |
| Polish (polski) | 115 | 9.3% |
Estate Spoken Language
| Language | Population | Percentage |
| Ruthenian (ukrainisch) | 4 | 4.9% |
| Polish (polski) | 78 | 95.1% |
Key Observations (1869-1890)
- Population Surge: The total population grew from 1,032 in 1869 to 1,313 in 1890 a 27% increase.
- The Estate: The “Gutsgebiet” is specifically identified as Putiatyńce mit Zabiniec, showing that the 82 people in this category were likely workers or residents of the Zabiniec settlement associated with the manor.
The final set of documents provides data from the 1900 Austrian Census (specifically the Gemeindelexikon). This is the most comprehensive dataset yet, adding specific details on livestock and the geographic composition of the village.
| Category | Land Area (Hectares) | Houses | Male | Female | Total |
| Dorf (Village) | 874 | 226 | 705 | 701 | 1,406 |
| Gutsgebiet (Estate) | 572 | 12 | 42 | 33 | 75 |
| Combined Total | 1,446 | 238 | 747 | 734 | 1,481 |
Village Religious Confession
| Religion | Population | Percentage |
| Greek Catholic (gr.-kat.) | 1,241 | 88.3% |
| Roman Catholic (rzym.-kat.) | 144 | 10.2% |
| Jewish (israelit.) | 21 | 1.5% |
Estate Religious Confession
| Religion | Population | Percentage |
| Greek Catholic (gr.-kat.) | 18 | 24.0% |
| Roman Catholic (rzym.-kat.) | 51 | 68.0% |
| Jewish (israelit.) | 5 | 6.7% |
| Other | 1 | 1.3% |
Village Spoken Language
| Language | Population | Percentage |
| Ruthenian (ukrainisch) | 1,225 | 87.1% |
| Polish (polski) | 181 | 12.9% |
Estate Spoken Language
| Language | Population | Percentage |
| Ruthenian (ukrainisch) | 0 | 0% |
| Polish (polski) | 75 | 100% |
Putiatyńce was primarily agrarian with the following breakdown of land use:
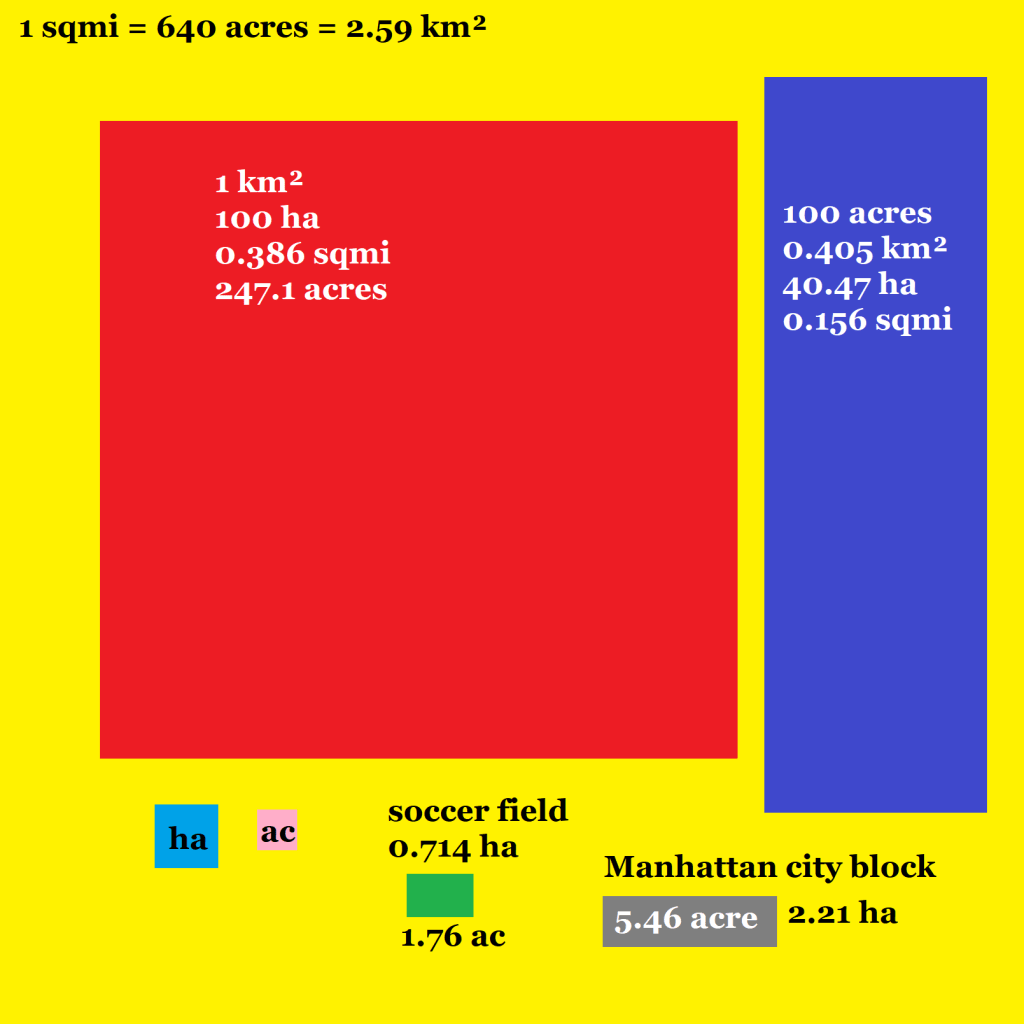
- Total Areal: 1,446 Hectares (approx. 14.46 square kilometers).
Land Types: 837 ha of arable land (Äcker), 323 ha of Meadows (Wiesen), 55 ha of Gardens (Gärten), and 42 ha of Pastures (Hutweiden) and 142 ha of Woods (Wald).
Historical Trajectory (1869–1900)
By synthesizing all four files, we can see the clear expansion of Putiatyńce over roughly 30 years:
| Census Year | Total Population | Number of Houses | Key Features Noted |
| 1869 | 1,032 | 160 | Basic population count. |
| 1880 | 1,058 | 180 | Transition toward detailed religious data. |
| 1890 | 1,313 | 210 | Growth of Zabiniec settlement; school noted. |
| 1900 | 1,481 | 238 | Peak population; detailed livestock/land data. |
Key Takeaways
- Consistent Growth: The village grew by nearly 44% over this period, necessitating the construction of over 70 new homes.
- Social Stability: While the population grew, it remained a predominantly Ukrainian, Greek Catholic farming community, even as the Polish Roman Catholic minority steadily increased from 4% to roughly 10%.
Population Growth (1869–1910)
| Year | Total Population | Number of Houses | Avg. People per House |
| 1869 | 1,032 | 160 | 6.5 |
| 1880 | 1,058 | 180 | 5.9 |
| 1890 | 1,313 | 210 | 6.3 |
| 1900 | 1,481 | 238 | 6.2 |
Land Distribution: Village vs. Estate
Using the most detailed data (from the 1900 file), we can see a stark contrast in land ownership. While the village community held more total land, the “Gutsgebiet” (the manor/estate) was controlled by a tiny fraction of the population.
Total Land Area: 1,446 Hektars (ha)
Village Land: 874 ha (60.5% of total land)
Estate Land: 572 ha (39.5% of total land)
Per Capita Land Availability
This calculation highlights the economic disparity between a common villager and the residents of the estate.
| Category | Population (1900) | Available Land | Land Per Person |
| Village | 1,406 | 874 ha | 0.62 Hektars |
| Estate | 75 | 572 ha | 7.62 Hektars |
On average, someone living on the estate had access to over 12 times more land than a resident of the village. Even though the village grew significantly in population, its land boundaries remained relatively static, leading to the increased density and “land hunger” common in late 19th-century Galicia.
Population Growth & Land Stress
The population grew by roughly 44% over three decades, but the village boundaries did not expand proportionally. This forced families to divide their land into smaller, less sustainable plots.
| Census Year | Village Population | Houses | Per Capita Land (Village) |
| 1869 | 976 | 153 | ~0.90 Hectares |
| 1880 | 1,009 | 174 | ~0.87 Hectares |
| 1890 | 1,231 | 201 | ~0.71 Hectares |
| 1900 | 1,406 | 226 | 0.62 Hectares |
Sustainability: How much land was needed?
In 19th-century Galicia, surviving on a private plot was extremely difficult. Historical estimates for traditional, non-mechanized farming suggest:
- Subsistence Limit: A typical peasant household needed 2 to 4 hectares to be truly self-sufficient (producing enough food for a family plus seed for the next year).
- The Reality in Putiatyńce: By 1900, the average villager had only 0.62 hectares. This was below the threshold for full self-sufficiency, meaning most families had to supplement their income by working on the local estate or migrating seasonally. Communal Support: To survive on such small plots, villagers relied heavily on communal lands for grazing cattle and gathering firewood—resources that were increasingly under threat from privatization in this era.
Estate vs. Village Comparison (1900)
The estate (Gutsgebiet) residents lived in a completely different economic reality.
- Land Ownership: The estate controlled 39.5% of the land (572 ha) but housed only 5% of the people (75 residents).
- Individual Advantage: One person on the estate had access to 7.62 hectares, more than 12 times the land available to a common villager.
Livestock & Mechanization
The census data reveals that the estate was significantly more invested in heavy labor and meat/dairy production than the individual villager.
| Livestock | Village (1,406 people) | Estate (75 people) |
| Horses | 199 (1 per 7 people) | 45 (1 per 1.6 people) |
| Cattle | 469 (1 per 3 people) | 200 (2.7 per 1 person) |
| Pigs | 201 (1 per 7 people) | 142 (1.9 per 1 person) |
- The Estate: With nearly 3 cows for every 1 person, the estate was a commercial livestock operation. The high ratio of horses (almost one per adult) suggests they used more advanced plowing and transport machinery.
- The Village: Horses were a luxury; most families shared a single horse among 7 or 8 people, or relied on manual labor. The livestock here was for survival (milk and manure for fertilizer) rather than profit.
Why This Matters
The 1869–1900 census period is critical because it captures the aftermath of the 1848 emancipation of serfs. Despite being “free,” many peasants lost access to communal forests and pastures (servitudes) to large estates. By 1900, nearly 80% of peasant plots were less than 5 acres, making them “dwarf holdings” unable to support a family, while estates of over 100 hectares dominated the landscape.
That is how Austrian Galicia’s land distribution drove a generation to emigrate.
A staggering 22.8% (320 men and women) of the villagers of Putiatyńce, left for Rochester, New York between 1902 – 1913.

Leave a comment